How to Run an Accurate A/B Test When Switching a DTC Payments Partner
We’ve helped more than thirty publishers migrate to our DTC payments system from competitors, and now we’re pulling back the curtain:
How do you actually measure the right KPIs and how to run an ״apples to apples״ A/B test, so you can choose a DTC partner based on margin, not marketing?
Practical steps for running your A/B test
This is what Michal Ronen, our Head of Business Analysis and I suggest:
Set up
Prioritize Net income as main KPI: While ARPU and conversion rates provide insight into user behavior, the ultimate decision should be based on Net Income. Calculate the revenue generated minus all fees.
Define sample size: Use a statistical power calculator to determine the population size needed to reach statistical significance. For Net Income, calculate Net Income per eligible user.
Balance your groups: To ensure a fair comparison, don't rely on simple randomization. Group your players into "spend tiers" (e.g., Non-spenders, Minnows, and Whales) and split each tier 50/50 between your groups. This prevents one vendor from gaining an unfair advantage simply by being assigned more "Whale" accounts by chance.
Running the test
2 weeks minimum: Give the test time to ensure a fair comparison. The incumbent provider will likely show better performance initially due to its "Saved Card" advantage. You must give the vendor you are testing at least two weeks with your cohorts of players to maximize their own Saved Card usage and level the playing field.
Monitor for technical health: Throughout the run, monitor technical success rates to ensure users aren't experiencing integration errors that could void the test results.
Avoid middle of test changes: Do not adjust pricing, layouts, or group sizes once the test has begun. Changing things mid-test will just add variables, and then it’ll be hard to pinpoint what’s affecting performance.
Analysis and decision making
Statistical significance check: Ensure your results have reached a high confidence level (typically 80%+) before making a decision. If the lift in Net Income is within the margin of error, consider extending the test.
Segmented post mortem: Analyze results across different segments. A vendor might underperform globally but significantly outperform the incumbent in a specific high-value region or for a specific player tier.
Assess the learning curve: Compare the performance of the second week against the first. If the new partner Net Income grew as more cards were "saved," it indicates strong long-term potential.
The 2 KPIs That Actually Predict Bottom Line Revenue
These KPIs form the foundation of every A/B test we run for partners evaluating checkout or Payment Links performance.
KPI 1: Checkout Conversion Rate (CVR)
What is it: Percent of players who load the checkout and initiate a payment attempt.
Why it matters: CVR (sometimes referred to as CR) captures UI friction, load time, autofill, saved cards, CCT handoff (Android), and deep linking.
Formula: CVR = initiated payments / checkout loads
How to measure it: Track event-level funnel: checkout_load → payment_intent_created.
Data-backed tips
- Ensure the pay button is always visible and above the fold - keep a clear CTA, always
- Reduce distraction and noise; for iOS users, put focus on the Apple Pay button with a clear UX hierarchy. For Android, do the same with the Google Pay button.
- Add in their Player ID and their game’s profile image or avatar to create trust
KPI 2: Order Success Rate (OSR)
What is it: Percent of initiated transactions approved by the issuer.
Why it matters: OSR reflects acquirer routing, BIN logic, metadata quality, tokenization, and fraud rules.
Formula: OSR = approved payments / submitted payments
How to measure it: Isolate same BIN, same geos, same cohorts for Vendor A and Vendor B.
Difference between OSR and CVR: Order Success Rate shows intent as the user needs to actually click to pay; conversion rate is just opening the checkout - not necessarily clicking to pay.
Data-backed tips
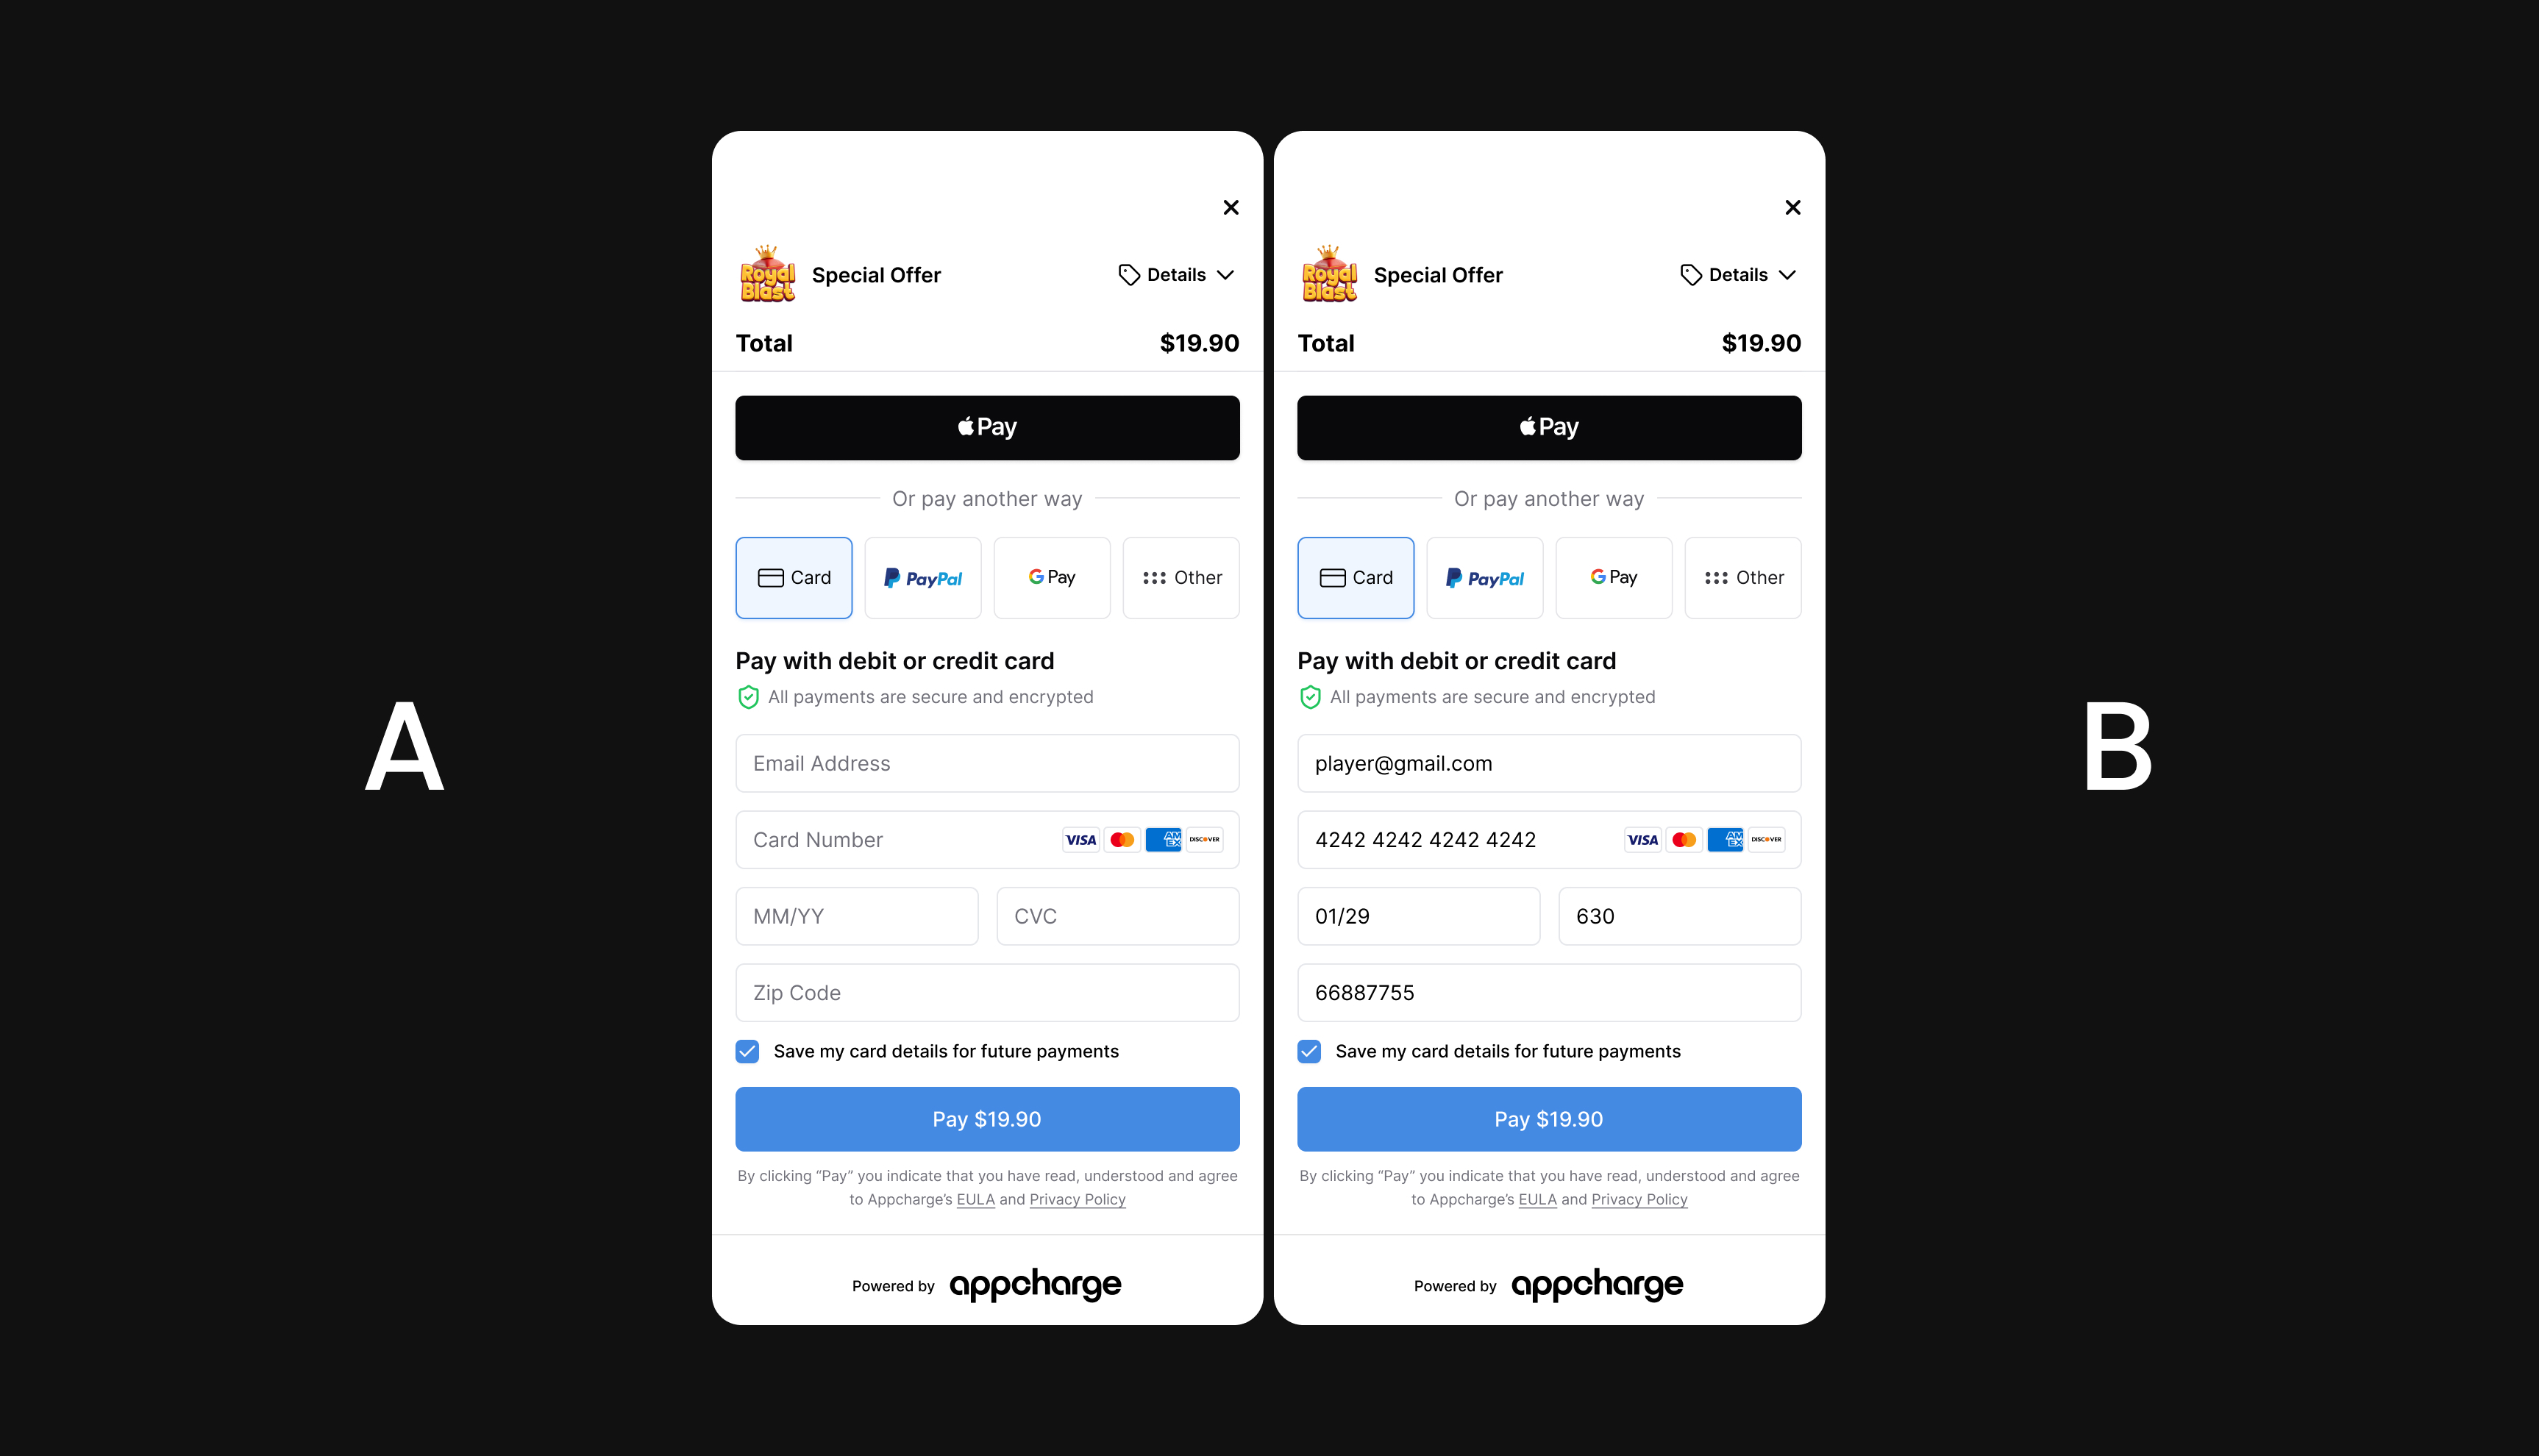
- Pre-fill email addresses to improve the credit card UX - you can do this by sending the emails to your payment provider
- Pre-fill post codes based on users’ IP address
The 4 Key Health Metrics That Support DTC Performance
False Positive Fraud Rate
What is it: Legitimate purchases blocked by automated fraud rules before authorization.
Formula: False Positive Rate = blocked legitimate attempts / all attempts
Why it matters: Invisible revenue leakage. Never appears in OSR or fee comparison charts.
Retry Recovery Rate
What is it: Percent of first-attempt failures recovered through smart retries.
Formula: Retry Recovery = recovered approvals / failed attempts
Why it matters: Smart retry strategies often add 0.5 to 3 percent uplift with zero player friction.
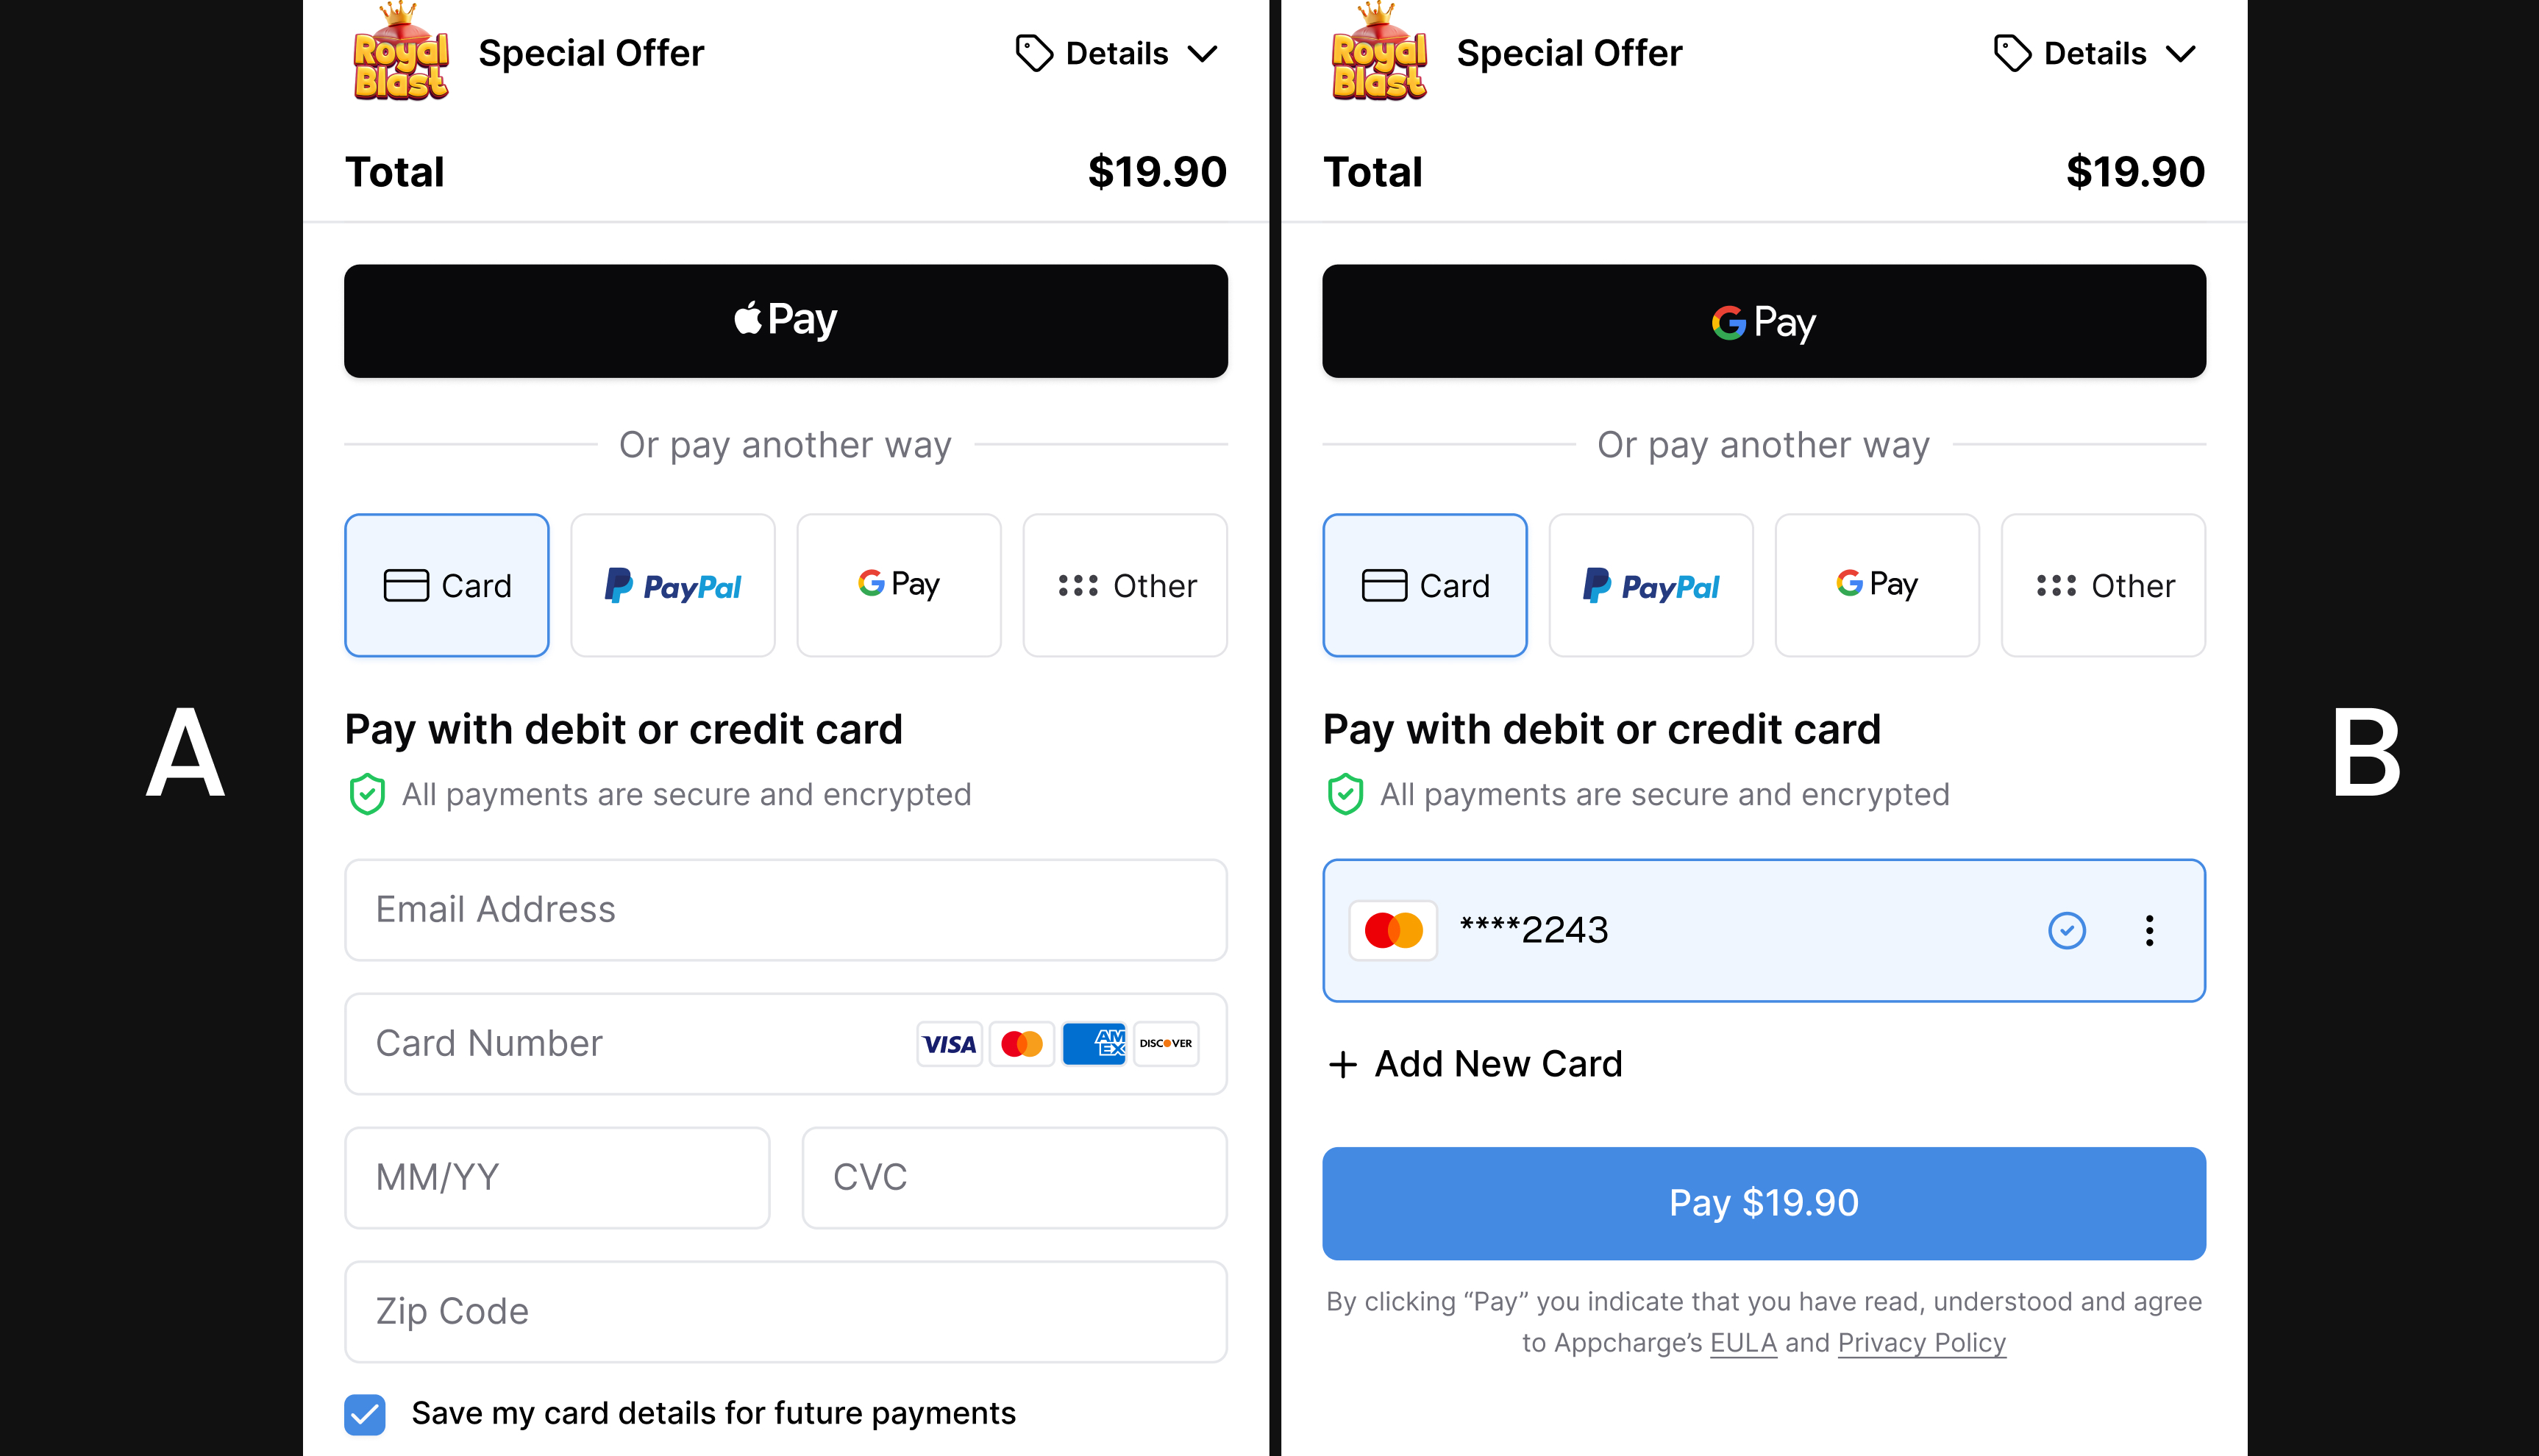
Saved Card Usage
What is it: Percent of returning users that complete payment with a previously saved card.
Formula: Users who paid with saved credit card / Users who paid with credit card
Why it matters: Saved cards drive higher CR and OSR.
Tip!
Check with vendors: Do they support card migration or token portability?
- Note that you’ll lose tokens during a PSP / MOR switch, which temporarily reduces revenue. Make sure you plan for this and wait until enough users have activated the Save Card function before carrying out the A/B test between existing and new vendors.
Payment Method Mix & Local APM Performance
What is it: Conversion and approval performance for each alternative payment method.
Formulas:
Deposits per APM
OSR per APM
CVR per APM
Total Revenue per APM
Why it matters: APM coverage is not a KPI - APM performance determines real revenue. Small numbers of players use APMs, but for companies with scale, it’s still significant revenue.
Our Black Friday activity with our partners - 100% uptime, 8000 transactions per minute, and sales boosting web store revenue over 50% week-over-week - was partly because we support APMs like CashApp, Link, Venmo.
Final advice
What matters is how many successful purchases your checkout produces, how consistently it does so across cohorts and regions, and how that translates into net income over time. When those metrics are measured properly, the picture becomes much clearer.
After supporting dozens of A/B tests and migrations, one pattern shows up again and again: short tests and surface-level KPIs lead to misleading conclusions, while full-funnel analysis reveals where real margin is created or lost. Use the KPIs and testing approach outlined here as your baseline; they’re the minimum standard that DTC teams should use when evaluating a payment partner.